Quick Start
Welcome to the vibrant documentation webpage!
Installation
The CMake build framework is used in order to compile the vibrant code. To install it type the following in the root directory of the repository and make sure that you have a working GNU Fortran compiler (e.g. gfortran):
mkdir build && cd build
cmake ..
make -j 5
See the Installation section for fine-grained installation instructions.
After installation, the compiled binary should be available in the build directory as build/vibrant and can be invoked e.g. from the root directory by the command
build/vibrant input.txt
For more details on the input.txt format, see the Usage section and the Keyword Glossary.
Information about the required data and file formats can be found on the File Formats.
Example Static IR Spectrum of o-Nitrophenol
For the calculation of the IR spectrum, we need to define the input.txt file.
For o-Nitrophenol (o-NP), it can look as follows.
&global
   spectra IR
   temperature 300
   fwhm 5
&end global
&system
   filename o-NP.xyz
&end system
&static
   diag_hessian y
   &hessian
      force_file o-NP-force.data3
   &end hessian
displacement 0.001
&end static
&dipoles
   type_dipole berry
   dip_file dipole_o-NP_free_static.xyz
&end dipoles
In addition, we need the data to feed to vibrant. For calculating the static IR spectrum we need the coordinates of o-NP, the forces for computing the Hessian, and the dipole data for calculating the intensities. Check IR spectrum documentation for more theoretical background.
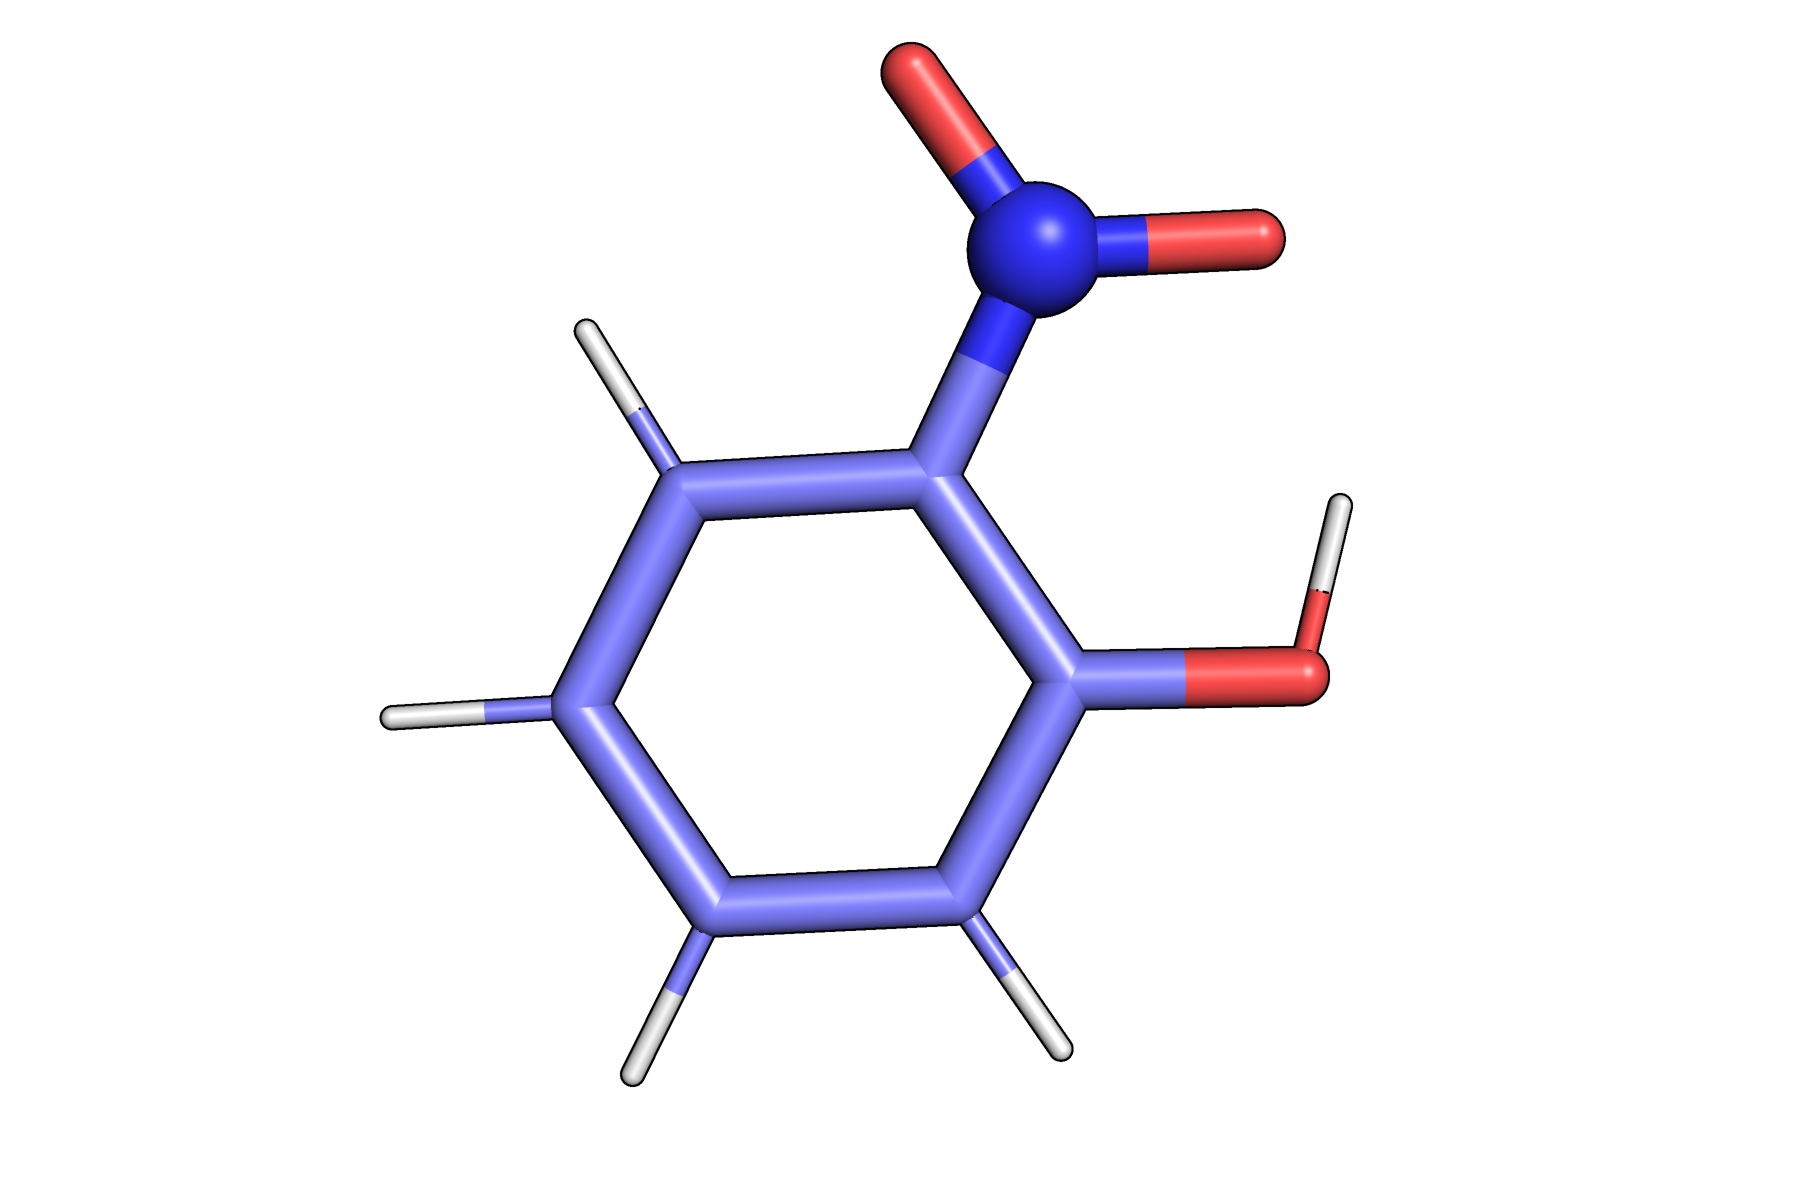
o-Nitrophenol structure used for IR spectrum calculation
Data files for o-NP can be downloaded here:
After running vibrant, multiple output files are produced.
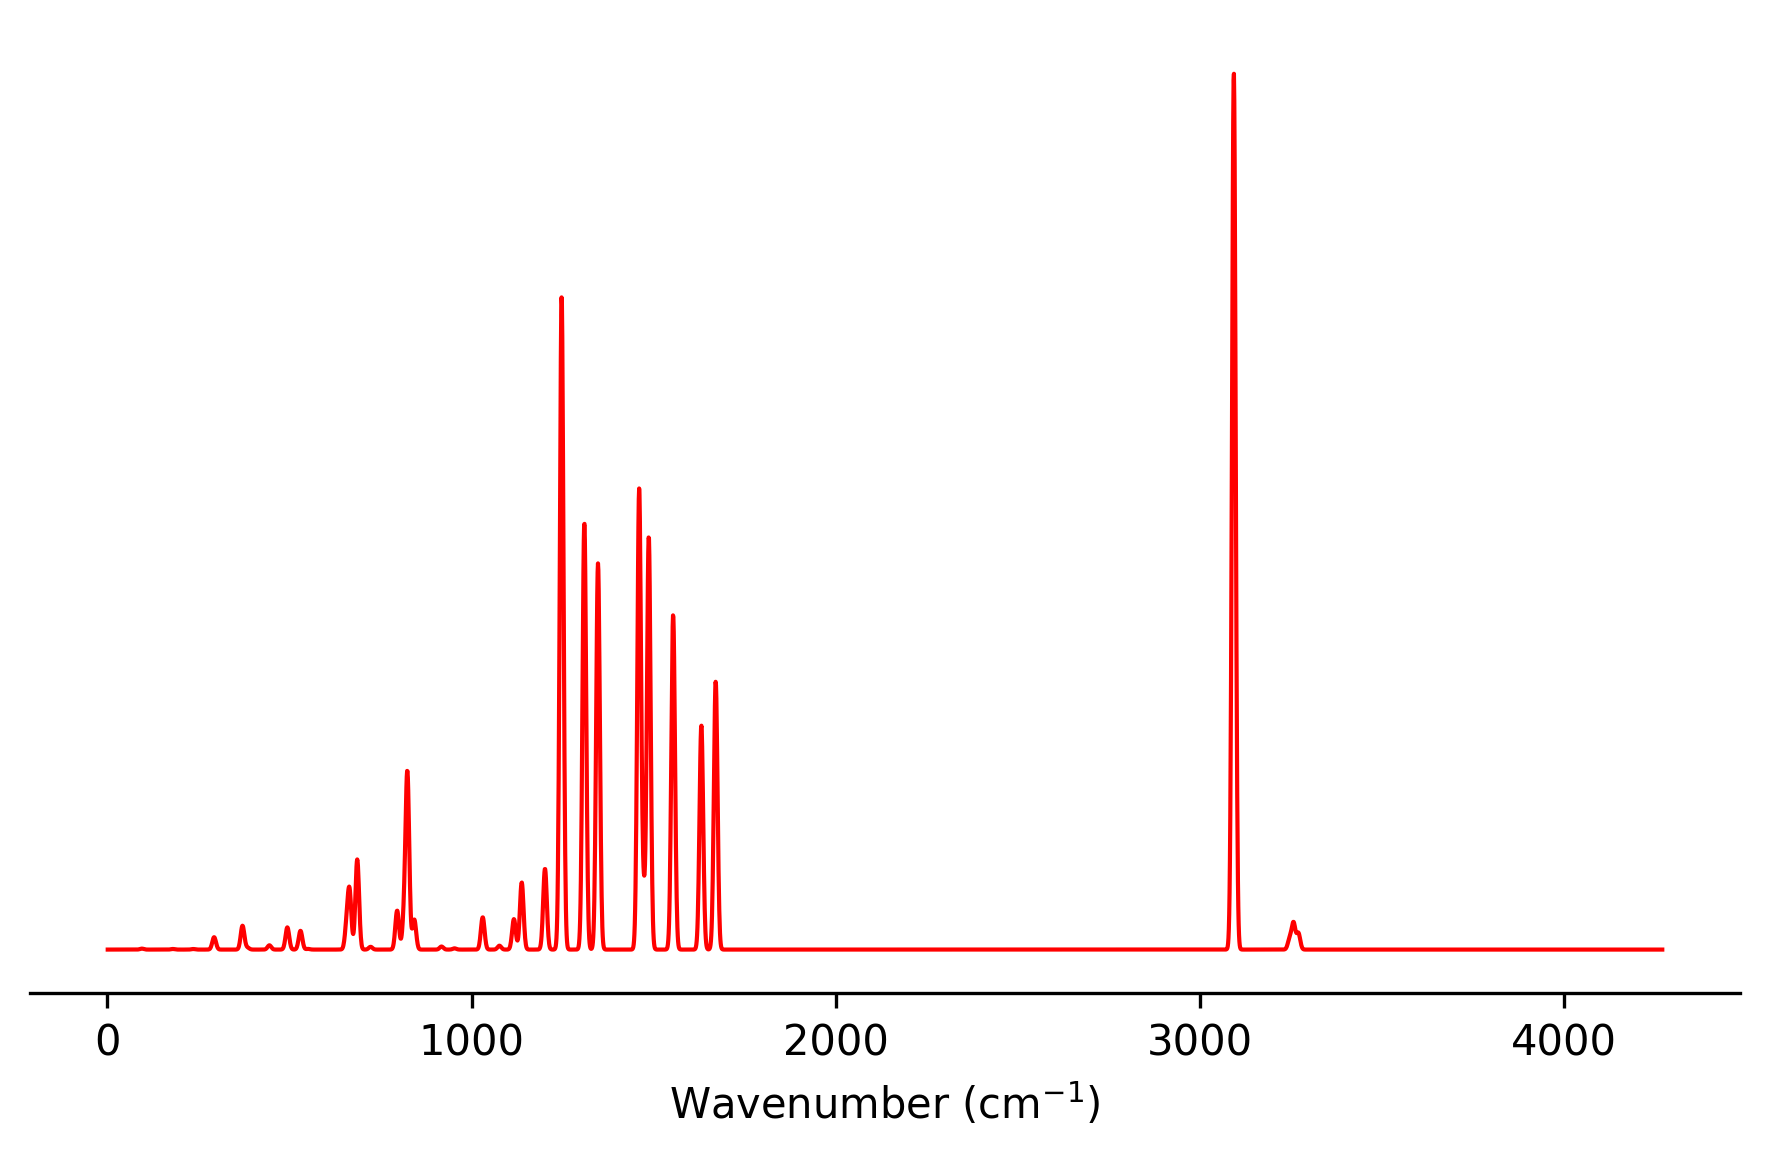
The spectral information is written to result_static_ir.txt and can be plotted
with a simple Python script, for example:
import numpy as np
import matplotlib.pyplot as plt

filename = "result_static_ir.txt"
data = np.loadtxt(filename, skiprows=1)
x, y = data[:, 0], data[:, 1]
# === Plot ===
plt.figure(figsize=(6, 4))
plt.plot(x, y, color="red", linewidth=1)
plt.xlabel("Wavenumber (cm$^{-1}$)")
plt.title("")
ax = plt.gca()
ax.yaxis.set_visible(False)
ax.spines['top'].set_visible(False)
ax.spines['right'].set_visible(False)
ax.spines['left'].set_visible(False)

plt.tight_layout()
plt.show()
More examples for calculating vibrational spectra can be found in the Examples section.